

G7 Dashboard on Gender Gaps - Italy
Download PDF version
G7 Dashboard on Gender Gaps 2025 – Italy (PDF, 11 pages, 743 KB)Education
Indicator 1. OECD PISA Mathematics scores (♂ boys; ♀ girls)
Indicator 1. Graph description
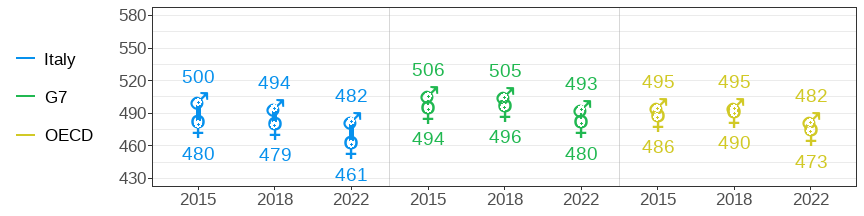
The chart shows the OECD Mathematics scores of Italy, the G7 and the OECD in the years 2015, 2018 and 2022 for boys and girls.
-
In 2015 boys in Italy scored 500 on average, while girls in Italy scored 480 on average. In 2018 boys in Italy scored 494 on average, while girls in Italy scored 479 on average. In 2022 boys in Italy scored 482 on average, while girls in Italy scored 461 on average.
-
In 2015 boys in the G7 scored 506 on average, while girls in the G7 scored 494 on average. In 2018 boys in the G7 scored 505 on average, while girls in the G7 scored 496 on average. In 2022 boys in the G7 scored 493 on average, while girls in the G7 scored 480 on average.
-
In 2015, boys in the OECD scored 495 on average, while girls in the OECD scored 486 on average. In 2018, boys in the OECD scored 495 on average, while girls in the OECD scored 490 on average. In 2022, boys in the OECD scored 482 on average, while girls in the OECD scored 473 on average.
Indicator 2a. Share of the population aged 25–64 who attained tertiary education
Indicator 2a. Graph description
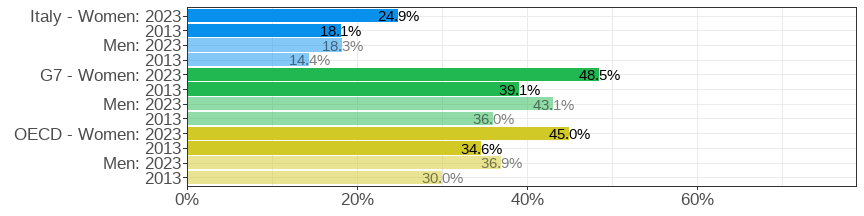
The chart shows the share of women and men aged 25–64 who attained tertiary education in Italy, the G7 and the OECD in 2013 and 2023.
-
In Italy in 2013, 18.1 percent of women attained tertiary education and 14.4 percent of men attained tertiary education. In 2023, 24.9 percent of women attained tertiary education and 18.3 percent of men attained tertiary education.
-
In the G7 in 2013, 39.1 percent of women attained tertiary education and 36.0 percent of men attained tertiary education. In 2023, 48.5 percent of women attained tertiary education and 43.1 percent of men attained tertiary education.
-
In the OECD in 2013, 34.6 percent of women attained tertiary education and 30.0 percent of men attained tertiary education. In 2023, 45.0 percent of women attained tertiary education and 36.9 percent of men attained tertiary education.
Indicator 2b. Share of women among tertiary graduates in Science, Technology, Engineering and Mathematics (STEM)
Indicator 2b. Graph description
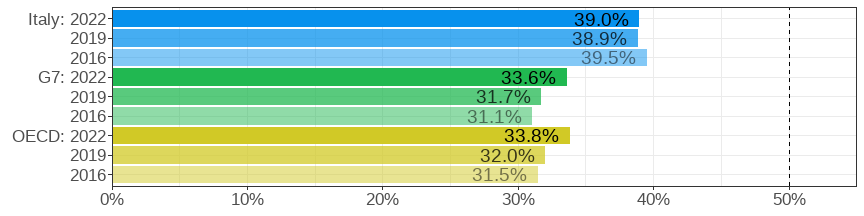
The chart shows the share of women among all tertiary graduates in STEM in Italy, the G7 and the OECD in 2016, 2019 and 2022.
-
In Italy in 2016 the share was 39.5 percent. In 2019 it was 38.9 percent. In 2022, it was 39.0 percent.
-
In the G7 in 2016 the share was 31.1 percent. In 2019 it was 31.7 percent. In 2022, it was 33.6 percent.
-
In the OECD in 2016 the share was 31.5 percent. In 2019 it was 32.0 percent. In 2022, it was 33.8 percent.
Employment and Social Security
Indicator 3a. Labour force participation rate among 15-64-year-olds (♂ men; ♀ women)
Indicator 3a. Graph description
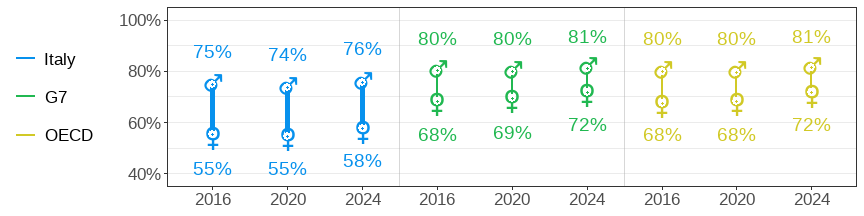
The chart shows the labour force participation rate of men and women aged 15–64 in Italy, the G7 and the OECD in 2016, 2020 and 2024.
-
In 2016, 55 percent of the women in Italy were participating, while 75 percent of the men were participating. In 2020, 55 percent of the women in Italy were participating, while 74 percent of the men were participating. In 2024, 58 percent of the women in Italy were participating, while 76 percent of the men were participating.
-
In 2016, 68 percent of the women in the G7 were participating, while 80 percent of the men were participating. In 2020, 69 percent of the women in the G7 were participating, while 80 percent of the men were participating. In 2024, 72 percent of the women in the G7 were participating, while 81 percent of the men were participating.
-
In 2016, 68 percent of the women in the OECD were participating, while 80 percent of the men were participating. In 2020, 68 percent of the women in the OECD were participating, while 80 percent of the men were participating. In 2024, 72 percent of women in the OECD were participating, while 81 percent of men were participating.
Indicator 3b. Share of women among all part-time employees aged 15-64 (< 30h per week)
Indicator 3b. Graph description
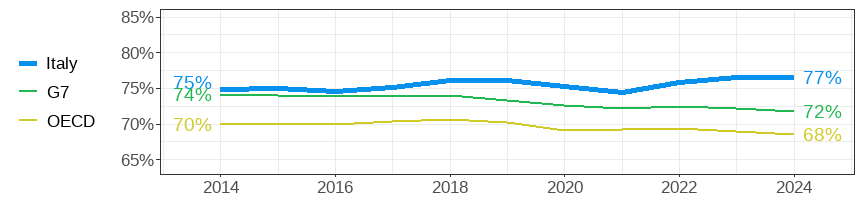
The chart shows the share of women aged 15–64 among all part-time employees (less than 30 hours per week) in Italy, the G7 and the OECD from 2014 to 2024.
-
In Italy in 2014 the share was 75 percent. In 2024, it was 77 percent.
-
In the G7 in 2014, the share was 74 percent. In 2024 it was 72 percent.
-
In the OECD in 2014, the share was 70 percent. In 2024 it was 68 percent.
Indicator 3c. Share of women in STEM jobs
Indicator 3c. Graph description
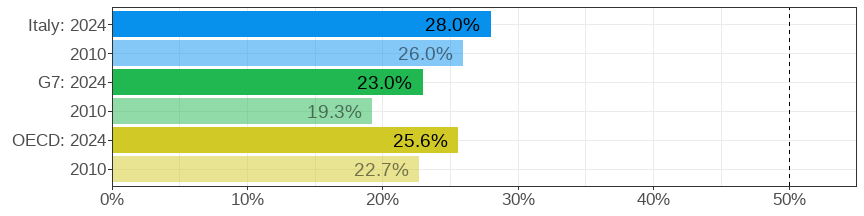
The chart shows the share of women in STEM jobs in Italy, the G7 and the OECD in 2010 and 2024.
-
In Italy in 2010 the share was 26.0 percent. In 2024 it was 28.0 percent.
-
In the G7 in 2010 the share was 19.3 percent. In 2024 it was 23.0 percent.
-
In the OECD in 2010 the share was 22.7 percent. In 2024 it was 25.6 percent.
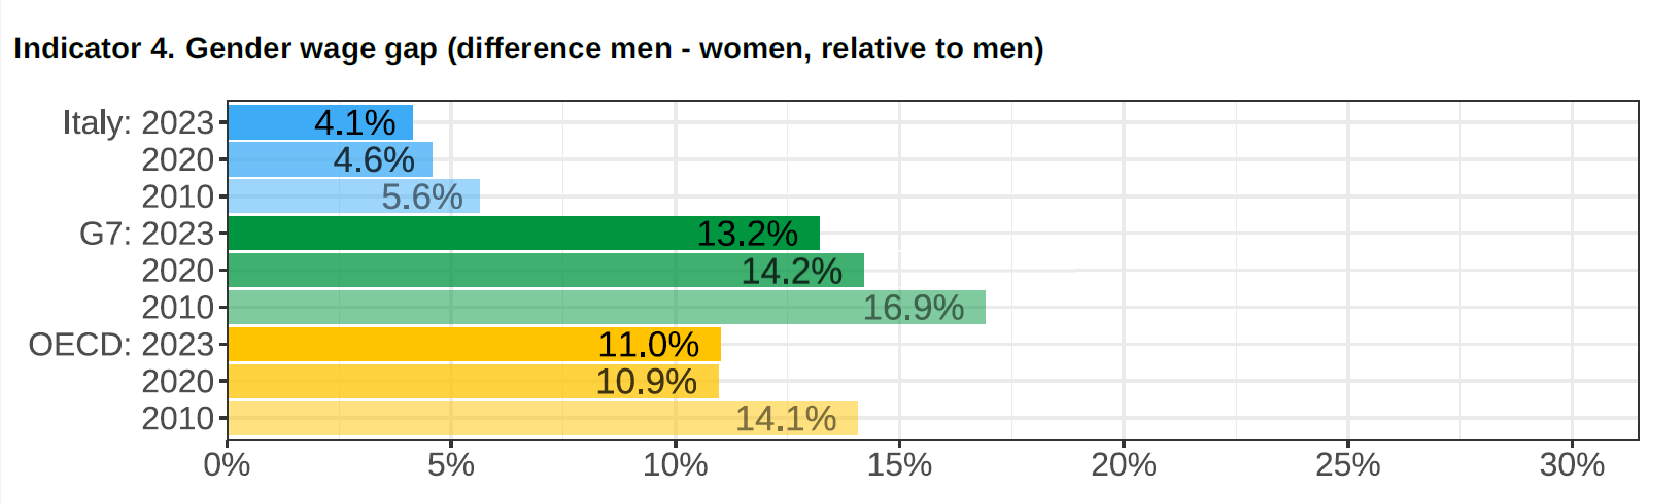
Indicator 4. Gender wage gap (difference men - women, relative to men)
Indicator 4. Graph description
The chart shows the gender wage gap in Italy, the G7 and the OECD in 2010, 2020 and 2023.
-
In Italy in 2010 the gap was 5.6 percent. In 2020 it was 4.6 percent. In 2023, it was 4.1 percent.
-
In the G7 in 2010 the gap was 16.9 percent. In 2020 it was 14.2 percent. In 2023, it was 13.2 percent.
-
In the OECD in 2010 the gap was 14.1 percent. In 2020 it was 10.9 percent. In 2023, it was 11.0 percent.
Indicator 5a. Gender gap in unpaid care and housework in minutes per day (♂ men ; ♀ women)
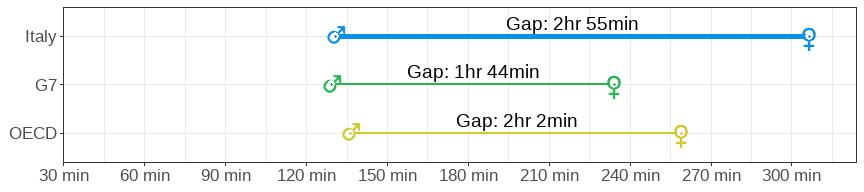
Comment: The equal sharing of unpaid work between women and men is of highest political priority to the G7. This indicator is included in the Dashboard as a placeholder, highlighting the lack of internationally comparable data.
Indicator 5a. Graph description
The chart shows the gender gap in unpaid care and housework in Canada, the G7 and the OECD.
-
In Canada the gap is 1 hour and 20 minutes per day.
-
In the G7 the gap is 1 hour and 44 minutes per day.
-
In the OECD the gap is 2 hours and 2 minutes per day.
Indicator 5b. Net childcare costs for parents using childcare facilities (as % of average wage)
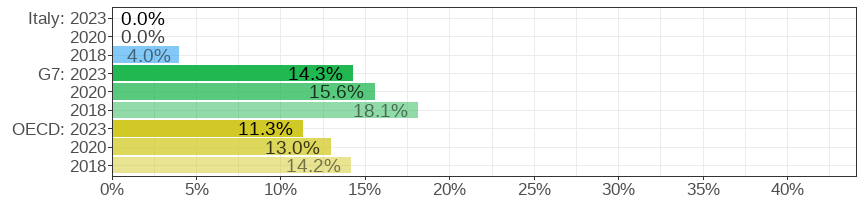
Comment: Calculations on net childcare costs seek to approximate typical settings for publicly provided full-time centre-based childcare in each country (where this option exists), and childcare settings for a specific sub-national jurisdiction have been used as follows: Ontario for Canada; Berlin for Germany; Rome for Italy; England for the United Kingdom; and, Michigan for the United States. For France and Japan, national rules apply and for EU countries, see OECD Data Explorer. As costs reflect the situation in one geographical location, they are not necessarily representative for the whole country.
Indicator 5b. Graph description
The chart shows the net childcare costs for parents using childcare facilities as a percentage of average wage in Italy, the G7 and the OECD in 2018, 2020 and 2023.
-
In Italy in 2018, net childcare costs for parents using childcare facilities was 4.0 percent of their average wage. In 2020, it was 0.0 percent of their average wage. In 2023, it was 0.0 percent of their average wage.
-
In the G7 in 2018, net childcare costs for parents using childcare facilities was 18.1 percent of their average wage. In 2020, it was 15.6 percent of their average wage. In 2023, it was 14.3 percent of their average wage.
-
In the OECD in 2018, net childcare costs for parents using childcare facilities was 14.2 percent of their average wage. In 2020, it was 13.0 percent of their average wage. In 2023, it was 11.3 percent of their average wage.
Indicator 6. Gender gap in pension income (difference men - women, relative to men), 2024 or latest
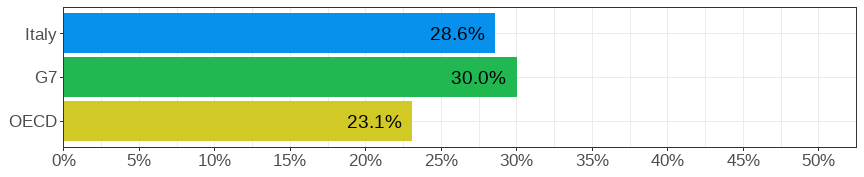
Indicator 6. Graph description
The chart shows the gender gap in pension income in Italy, the G7 and the OECD in 2024 or latest available data.
-
In Italy the gap is 28.6 percent.
-
In the G7 the gap is 30.0 percent.
-
In the OECD the gap is 23.1 percent.
Entrepreneurship
Indicator 7. Share of self-employed with and without employees among all employed
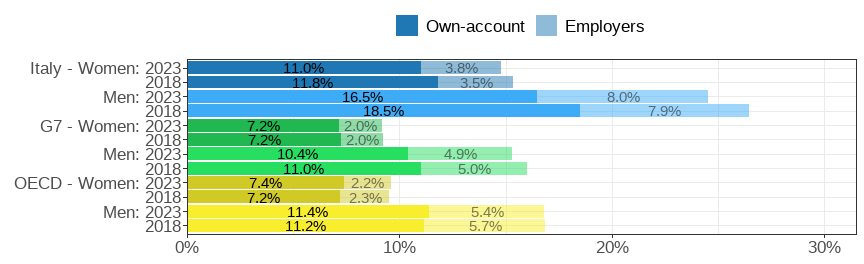
Indicator 7. Graph description
The chart shows the share of self-employed women and men in Italy, the G7 and the OECD in 2018 and 2023.
-
In 2018 in Italy, 3.5 percent of the women are self-employed and have employees, while 11.8 percent of the women are self-employed without employees. 7.9 percent of the men are self-employed and have employees, while 18.5 percent of the men are self-employed without having employees. In 2023 in Italy, 3.8 percent of the women are self-employed and have employees, while 11.0 percent of the women are self-employed without employees. 8.0 percent of the men are self-employed and have employees, while 16.5 percent of the men are self-employed without having employees.
-
In 2018 in the G7, 2.0 percent of the women are self-employed and have employees, while 7.2 percent of the women are self-employed without having employees. 5.0 percent of the men are self-employed and have employees, while 11.0 percent of men are self-employed without having employees. In 2023 in the G7, 2.0 percent of the women are self-employed and have employees, while 7.2 percent of the women are self-employed without having employees. 4.9 percent of the men are self-employed and have employees, while 10.4 percent of men are self-employed without having employees.
-
In 2018 in the OECD, 2.3 percent of women are self-employed and have employees, while 7.2 percent of women are self-employed without having employees. 5.7 percent of men are self-employed and have employees, while 11.2 percent of men are self-employed without having employees. In 2023 in the OECD, 2.2 percent of women are self-employed and have employees, while 7.4 percent of women are self-employed without having employees. 5.4 percent of men are self-employed and have employees, while 11.4 percent of men are self-employed without having employees.
Leadership
Indicator 8a. Share of women in board seats of the largest publicly listed companies
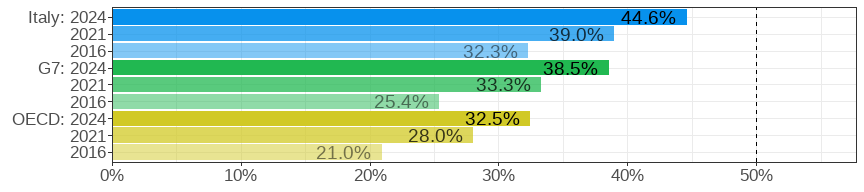
Indicator 8a. Graph description
The chart shows the share of women in board seats of the largest listed companies in Italy, the G7 and the OECD in 2016, 2021 and 2024.
-
In Italy in 2016 the share was 32.3 percent. In 2021 it was 39.0 percent. In 2024 it was 44.6 percent.
-
In the G7 in 2016 the share was 25.4 percent. In 2021 it was 33.3 percent. In 2024 it was 38.5 percent.
-
In the OECD in 2016 the share was 21.0 percent. In 2021 it was 28.0 percent. In 2024 it was 32.5 percent.
Indicator 8b. Share of Women CEOs (Chief Executive Officer), 2024
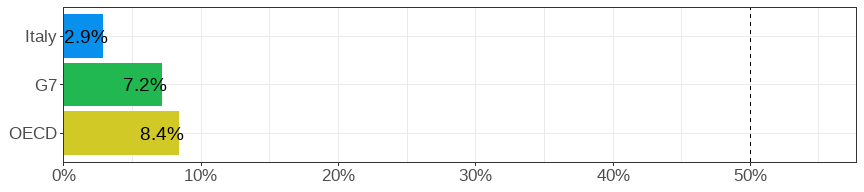
Indicator 8b. Graph description
The chart shows the percent of women Chief Executive Officers (CEOs) as part of the largest listed companies in Italy, the G7 and the OECD in 2024.
-
In Italy, 2.9 percent of the largest list companies have women CEOs.
-
In the G7, 7.2 percent of the largest list companies have women CEOs.
-
In the OECD, 8.4 percent of the largest list companies have women CEOs.
Indicator 9. Share of women in lower or single houses of parliament
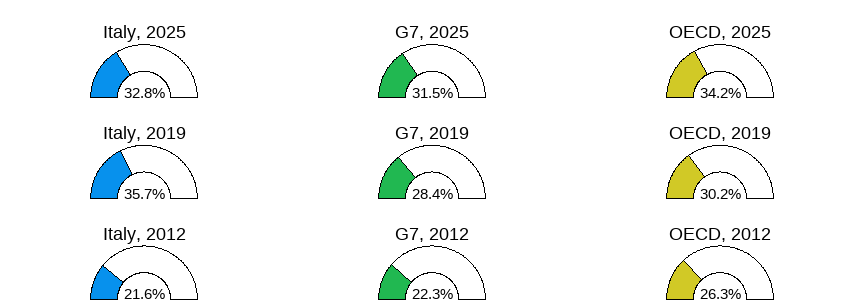
Indicator 9. Graph description
The chart shows the share of women in lower or single houses of parliament in Italy, the G7 and the OECD in 2012, 2019 and 2025.
-
In Italy in 2012, the share was 21.6 percent. In 2019 it was 35.7 percent. In 2025 it was 32.8 percent.
-
In the G7 in 2012 the share was 22.3 percent. In 2019 it was 28.4 percent. In 2025 it was 31.5 percent.
-
In the OECD in 2022 the share was 26.3 percent. In 2019 it was 30.2 percent. In 2025 it was 34.2 percent.
Intimate Partner Violence
Indicator 10. Prevalence of physical and/or sexual violence against women and girls by an intimate partner, 2021
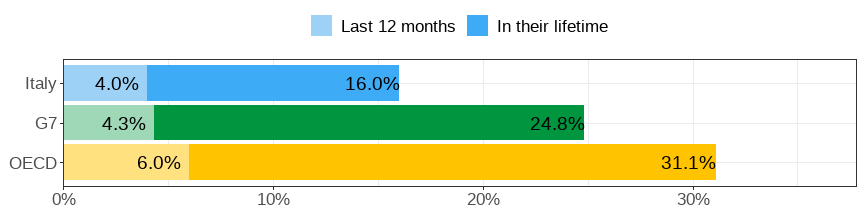
Comment: The issue of intimate partner violence is of the highest political priority to the G7. This indicator is included in the Dashboard as a placeholder, highlighting the lack of internationally comparable data.
Indicator 10. Graph description
The chart shows the prevalence of physical and/or sexual violence against women and girls by an intimate partner in Italy, the G7 and the OECD over the last twelve months and over their lifetime in 2021.
-
In Italy the prevalence over the last twelve months was 4.0 percent. Over their lifetime was 16.0 percent.
-
In the G7 the prevalence over the last twelve months was 4.3 percent. Over their lifetime was 24.8 percent.
-
n the OECD the prevalence over the last twelve months was 6.0 percent. Over their lifetime was 31.1 percent.
Health and Well-being
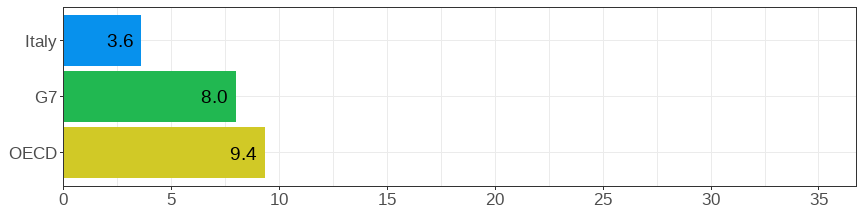
Indicator 11a. Maternal mortality per 100 000 live births, 2023 or latest
Comment: Methodological limitations should be reviewed carefully when drawing conclusions from the maternal mortality series.
Indicator 11a. Graph description
The chart shows the maternal mortality per 100,000 live births in Italy, the G7 and the OECD in 2023 or the latest data.
-
In Italy there were 3.6 maternal deaths per 100,000 live births.
-
In the G7 there were 8.0 maternal deaths per 100,000 live births.
-
In the OECD there were 9.4 maternal deaths per 100,000 live births.
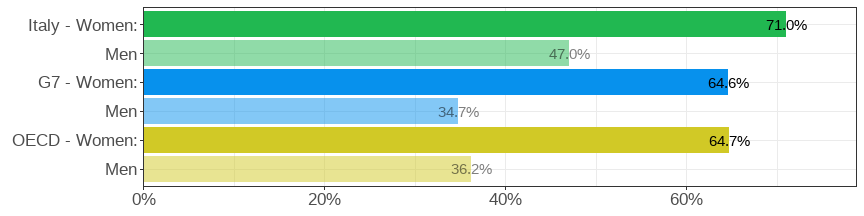
Indicator 11b. Knowledge of Menopause, 2022
Comment: Survey Question: How knowledgeable, if at all, would you say you are about menopause? Base 23,008 participants across 33 countries, interviewed online between 22 July and 5 August 2022, including 11,312 men and 11,696 women. The indicator on menopause is currently based on a one-time survey, but its inclusion is to emphasize the importance of a life-course approach in measuring women’s right to maintain health, dignity and well-being that extends beyond the reproductive capacity. This indicator relates directly to SDG Indicator 3.7.
Indicator 11b. Graph description
The chart shows the share of women and men who are knowledgeable about menopause in Italy, the G7 and the OECD in 2022.
-
In Italy, 71.0 percent of women said that they were knowledgeable about menopause and 47.0 of men said that they were knowledgeable about menopause.
-
In the G7, 64.6 percent of women said that they were knowledgeable about menopause and 34.7 of men said that they were knowledgeable about menopause.
-
In the OECD, 64.7 percent of women said that they were knowledgeable about menopause and 36.2 of men said that they were knowledgeable about menopause.
Funds for Development Cooperation
Indicator 12. Share of aid activities targeting gender equality as Significant (GE1) and Principal (GE2)
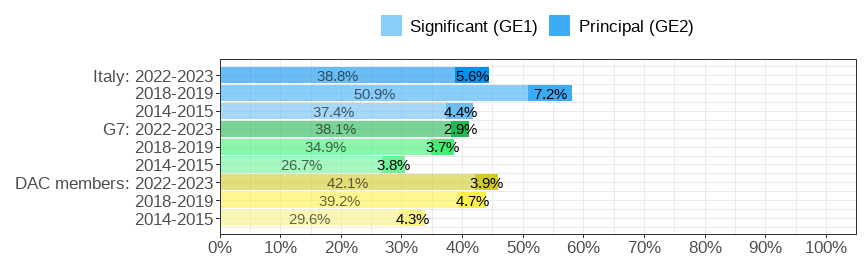
Indicator 12. Graph description
The chart shows the share of aid activities targeting gender equality in Italy, the G7 and among DAC members in 2014–2015, 2018–2019 and 2022–2023.
-
In Italy in the years 2014 to 2015 the share of aid activities targeting gender equality as significant (GE1) was 37.4 percent, the share of aid activities targeting gender equality as principal (GE2) was 4.4 percent. In the years 2018 to 2019 the share was 50.9 percent (GE1) and 7.2 percent (GE2). In the years 2022 to 2023 the share was 38.8 percent (GE1) and 5.6 percent (GE2).
-
In the G7 in the years 2014 to 2015 the share of aid activities targeting gender equality as significant (GE1) was 26.7 percent, the share of aid activities targeting gender equality as principal was 3.8 percent. In the years 2018 to 2019 the share was 34.9 percent (GE1) and 3.7 percent (GE2). In the years 2022 to 2023 the share was 38.1 percent (GE1) and 2.9 percent (GE2).
Notes and Sources
Throughout the Dashboard, all G7, OECD and EU averages refer to unweighted averages (with the exception of Indicator 12, see note). EU, throughout this document, does not refer to EU institutions, but to the average of EU member states. Where data for a country is missing for a specific year, averages are calculated using the most recent year available.
| Indicator | Description | Source | ||||||||||||
|---|---|---|---|---|---|---|---|---|---|---|---|---|---|---|
Education
|
||||||||||||||
Employment and Social Security
|
||||||||||||||
Entrepreneurship
|
||||||||||||||
Leadership
|
||||||||||||||
Intimate Partner Violence
|
||||||||||||||
Health and Well-being
|
||||||||||||||
Funds for Development Co-operation
|
||||||||||||||